Timeline palette
Updated: 07/04/2025
In the timeline palette, you can create motions, play them back, etc.
This page mainly describes the screen layout of the palette.
See the “Displaying and Operating the Timeline Palette” page for basic operations of the timeline palette.
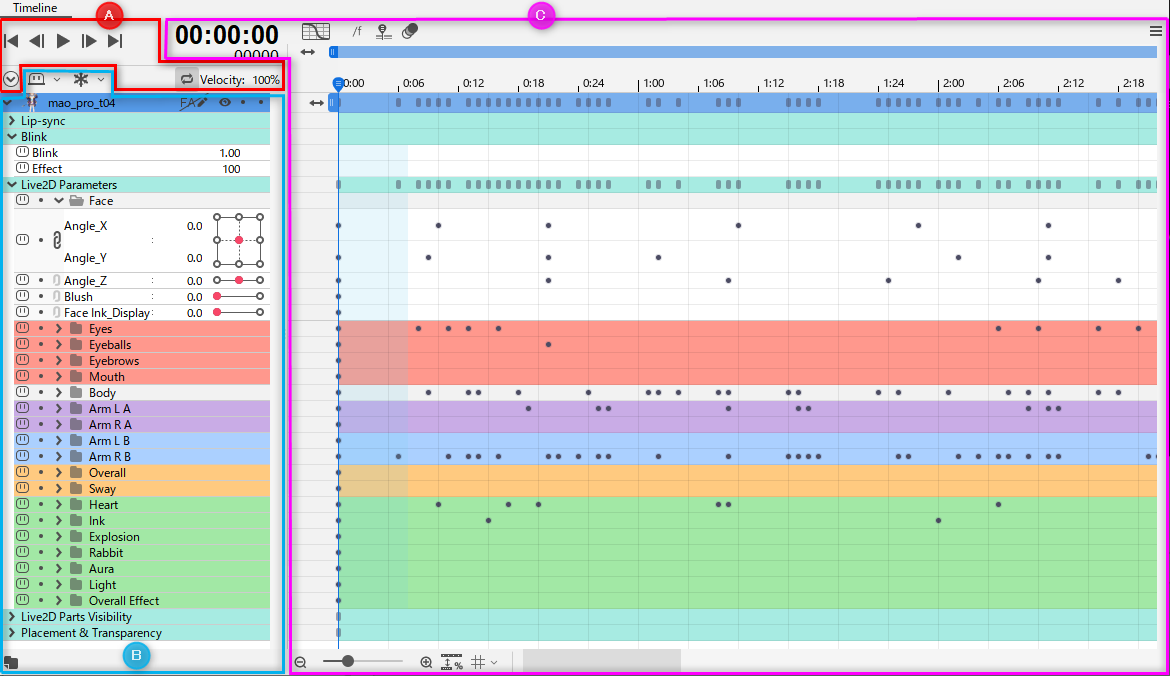
Timeline Palette Screen Layout
| Number | Item | Details |
|---|---|---|
| A | Playback and timeline movement | Controls related to the playback of the created motion are located in this section. |
| B | Tracks and properties | This section displays the parameters and display options created in the Modeling View, as well as the properties of the entire track. |
| C | Timeline | Time, keyframes, timeline display options, etc. are displayed here. Note that the contents displayed in the [Dope Sheet] and [Graph Editor] are different. |
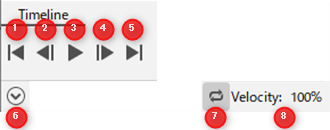
Playback and timeline movement
| Number | Item | Details |
|---|---|---|
| (1) | First frame | Move to the beginning of the Work Area. [Shift] + [Home] |
| (2) | Previous frame | Move back one frame. [Page Up] |
| (3) | Playback | Play back. [Enter] |
| (4) | Next frame | Move forward one frame. [Page Down] |
| (5) | Last frame | Move to the end point of the Work Area. [Shift] + [End] |
| (6) | Expand/collapse all | Expand and collapse all property groups in the timeline palette. |
| (7) | Repeat | Switch repeat playback on/off. |
| (8) | Velocity | Change the playback speed. 100% is the default. |
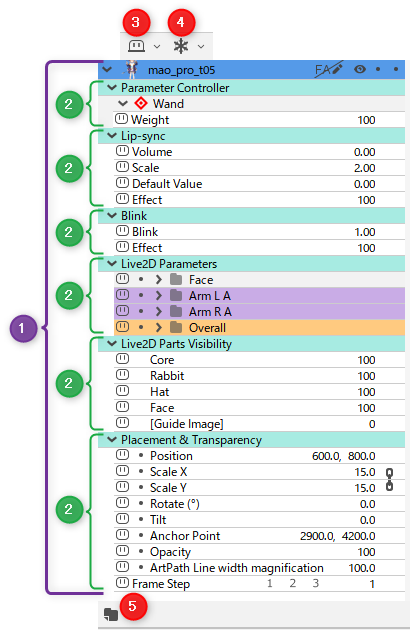
Tracks and properties
| Number | Item | Details |
|---|---|---|
| (1) | Track | The blue bars and area below are the tracks. Tracks are materials such as model files and audio files. Click the left-most triangular button to expand/collapse the list. (You can expand/collapse all property groups in a track by clicking and holding down [Shift].) Right-click on the bar to display the following menu. Duplicate Track: Duplicate tracks. Remove Track: Delete tracks. Edit Track Name: You can edit track names as desired. Use File Name: You can revert to the same name as the file name. Import Motion: You can import the motion3.json file. See “Parameter bookmarks” for information on the menu of parameter bookmarks. See “About the parameter controller” for information on the parameter controller menu. Click the FA button to open the Form Animation View. See the “About form animation (FA)” page for details. |
| (2) | Property group | The areas indicated by light blue bars in the light theme and green bars in the dark theme are the property groups for that track. The left-most triangular button can be used to expand/collapse the list. (You can expand/collapse all elements in a property group by clicking and holding down [Shift].) The items that appear when the image is expanded are properties, such as [Angle X], [Deformer], and [Opacity]. Sliders and values for parameters are shown on the far right. Eye blinking: This will appear when the eye blinking setting is set on the model in the Modeling View. Set this if you want to control eye blinking in the SDK. See “Eye blinking setting” for details. Lip-sync: This will appear when the lip-sync setting is set on the model in the Modeling View. Set this option if you want to control mouth movements in the SDK or if you want to automatically create lip-syncing from an audio file. See “Creating scenes with background music and audio” for details. Parameter controller: This item will appear when a single-point controller is added to the model. See “About the parameter controller” for details. Live2D Parameters: The parameters for the model are displayed. This can be operated in the same way as the Parameter palette in the Modeling View. Parameter names can expand the display area.  Live2D Parts Visibility: Opacity can be changed for each part. This can be used to switch between multiple patterns of arm parts. Placement & Opacity: You can edit the following items in models and images. [Deformer] [Scale X, Y] [Rotation (Angle)] [Tilt] [Anchor Point] [Opacity] [ArtPath Width Magnification] [Frame Step] |
| (3) | Shy | Show/hide properties in the timeline palette. After clicking the Shy button on the left end of each property to turn it on (hidden), click the Shy button at the top to apply. See “Shy function” for details. |
| (4) | Freeze | Stop certain properties on the timeline palette to check motions, positions, etc. Click the Freeze button at the left end of each property to turn it on, then click the Freeze button at the top to apply it. See “Freeze” for details. |
| (5) | Create new group | If you have a lot of material in use, you can create groups to store and organize your tracks. |
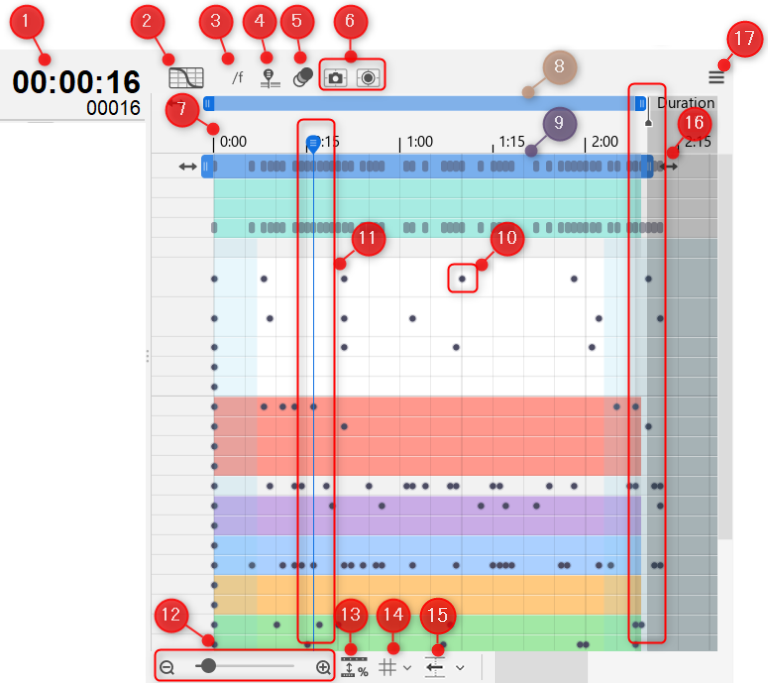
Timeline
Dope Sheet display
Create an animation by setting keyframes on the time axis of the timeline.
| Number | Item | Details |
|---|---|---|
| (1) | Current position (time) | The position of the indicator (11) is displayed in [minutes:seconds:frames]. |
| (2) | Graph Editor (or Dope Sheet) Switch to Graph Editor (or Dope Sheet) | Toggles between Graph Editor display and Dope Sheet display. |
| (3) | Toggle between frames / timecode | Switch between “sec + frame display” and “total frame display” on the rounded number (7). |
| (4) | Toggle free / fixed cursor timeline navigation | Turn on to lock the indicator. Normally, clicking anywhere on the timeline will move the indicator to that position, but this feature allows keyframes, etc. to be selected regardless of the indicator’s current position. |
| (5) | Button to switch between markers and onion skin markers | Toggles between marker and onion skin marker display with this button. Marker:  Onion skin marker:  |
| (6) | Recording button for external application integration | Inserts a keyframe in the timeline of the model track with the value of a parameter received from an external application. See “External Application Integration” for details. |
| (7) | Rounded Number | This is the rounded number of the timeline. It is displayed as “sec:frames” or “total frames.” This display can be switched between time display and frame count display using the toggle button (3). Markers can also be added. See “Marker function” for details. |
| (8) | Work Area | The area indicated by the blue bar is the Work Area. |
| (9) | Track | The area indicated by the blue bar is the track, and the green bar below it is the property group. The length of the blue bar indicates the starting and ending points of the displayed element. If a keyframe (10) is created for any of the properties, it will be marked. |
| (10) | Keyframe | This frame is the point of motion. |
| (11) | Indicator | The current position on the timeline. Time is indicated in (1). |
| (12) | Zoom in on the timeline | Reduce/expand the timeline. You can change the zoom level with the [-] and [+] buttons or the slider. The zoom level of the timeline can also be changed by [Alt] + [mouse wheel]. |
| (13) | Adjust spacing | Adjust the keyframe spacing of the selection. You can specify a % value for the scale from the [Adjust Spacing] dialog box. |
| (14) | Grid display | Display vertical lines in the graph area. Line spacing can be selected from [No vertical grid], [Every frame], [Every 5 frames], [sec], or [Frame step]. |
| (15) | Edit frames before frame 0 | Frames before frame 0 can be edited when this is on. You can select the range to be displayed from [Duration] [3 sec], [5 sec], [10 sec], [20 sec], [30 sec], [60 sec], [Duration+5 sec], and [Custom]. [Duration] displays the same length as the duration. If you want to set your own range, you can set the value in [Custom]. |
| (16) | Duration | The range up to this point is the duration and represents the length (scale) of the scene. In the dark-colored area on the right side, duration is shown in “sec + number of frames” and “total frames.” |
| (17) | Palette menu | Click to display the timeline palette menu. |
See “Displaying and operating the timeline palette” for more information.
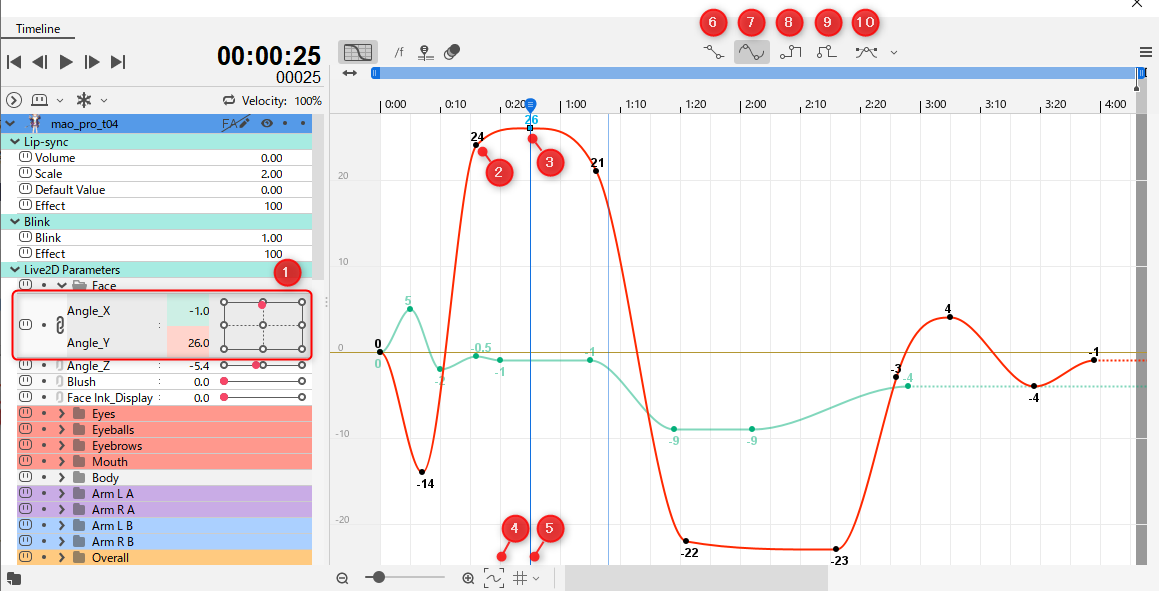
Graph Editor Display
Switch to the [Graph Editor] to display the graph.
Selecting a parameter for which a keyframe is set allows you to edit it.
You can also select multiple parameters, each with a different color for the line.
| Number | Item | Details |
|---|---|---|
| (1) | Selected parameters | The area highlighted in gray is the parameter being selected. |
| (2) | Keyframe | The dots are the keyframes. |
| (3) | Selected keyframes | Clicking on a keyframe to select it changes the shape of the point. |
| (4) | Resize | Restores the magnification of the curve. |
| (5) | Grid display | Display vertical lines in the graph area.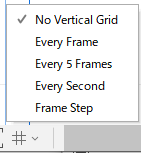 None: No line is displayed. Every Frame: Displays a line per frame. Every 5 Frames: Displays a line every 5 frames. sec: Displays a line every second. Frame Step: Displays lines at intervals set in Frame Step. See “Frame step” for details. |
| (6) | Linear | Change the line after the selected keyframe to a straight line. |
| (7) | Auto smooth | Change the line after the selected keyframe to a curve. |
| (8) | Step | Interpolate the line after the selected keyframe with a vertical line aligned with the previous keyframe. |
| (9) | Inverse step | Interpolate the line after the selected keyframe with a vertical line aligned with the previous keyframe. |
| (10) | Bezier | Create Bezier handles on selected keyframes, allowing them to be edited into freeform curves. |
See “Graph Editor” for details.
Was this article helpful?
YesNo